

Types of Athletic Performance Metrics: 2026 Guide
Athletic performance metrics are measurable indicators that quantify physical work, physiological response, and recovery to improve training outcomes. Sports science recognizes three primary categories: external load, internal load, and athlete state. Each category captures a different dimension of what happens to your body before, during, and after training. Understanding all three is the foundation of evidence-based training decisions that separate guesswork from real progress.
1. What are the types of athletic performance metrics?
Researchers categorize sports performance metrics into three groups: external load, internal load, and athlete state. External load measures the physical work you produce. Internal load captures how your body responds to that work. Athlete state reflects your recovery and readiness after the session ends. Using all three together gives coaches and athletes a complete picture of training stress and adaptation.
No single metric tells the full story. A systematic review of 82 studies confirmed that the most frequently tracked external load metrics are total distance, distance per speed zone, and acceleration and deceleration counts. That finding matters because it shows the field has converged on a core set of measures, not a scattered list of options.
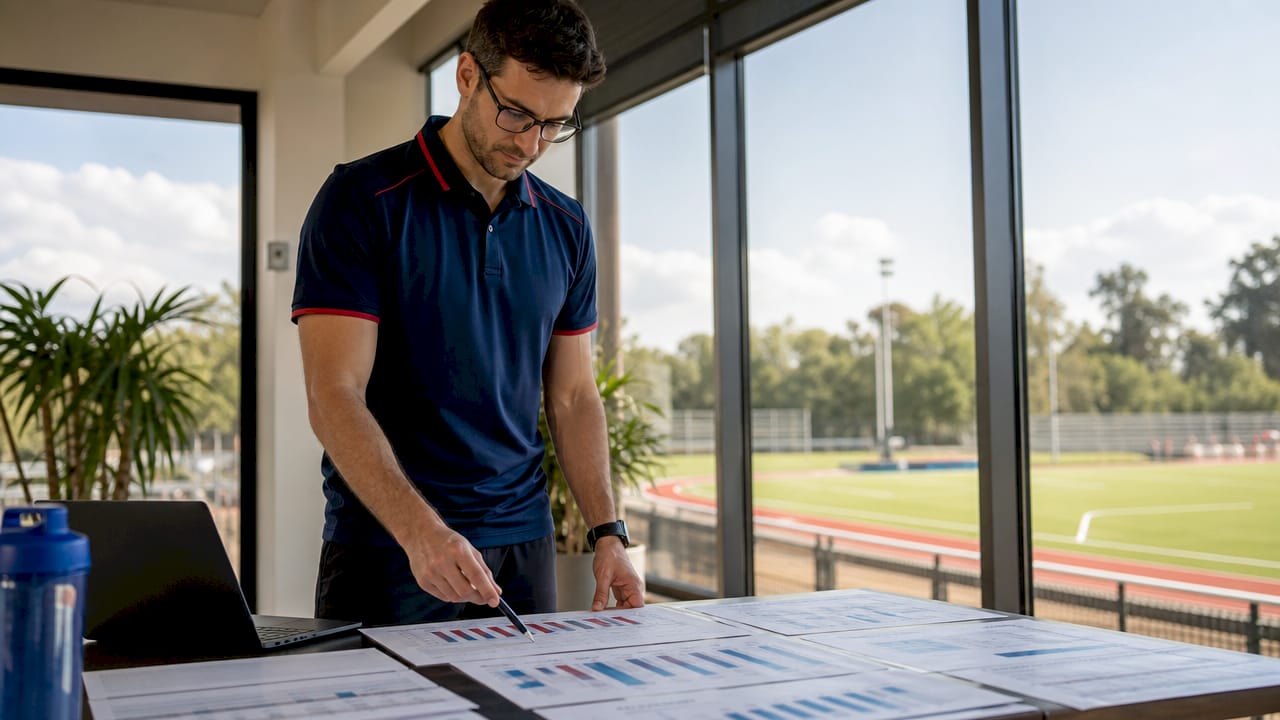
2. External load metrics: measuring physical work output
External load metrics quantify the actual physical demands placed on your body during a session. They measure what you do, not how your body feels doing it. GPS units, accelerometers, and inertial measurement units (IMUs) are the standard tools for collecting this data.
The most common external load indicators include:
- Total distance covered during a session or match
- Distance in speed zones (walking, jogging, running, sprinting)
- Sprint count and maximum sprint speed
- Acceleration and deceleration counts, which stress muscles and tendons more than steady running
- Player load, a composite score from accelerometer data across three movement planes
Acceleration and deceleration counts deserve special attention. High counts signal neuromuscular stress even when total distance looks moderate. A player who covers 8 kilometers with 40 hard decelerations faces a very different training load than one who covers the same distance at a steady pace.
Pro Tip: Combine at least three external metrics, such as total distance, sprint count, and deceleration count, to get an accurate picture of session demand. Relying on total distance alone underestimates the true physical cost.
Coaches use external load data to manage weekly training volume, plan recovery days, and prevent overtraining. Connecting these numbers to sports training program types helps you match the right workload to the right phase of your season.
3. How internal load metrics capture physiological response
Internal load metrics measure how your body reacts to the physical work you perform. Where external load tells you what was done, internal load tells you what it cost your physiology. These metrics are collected during exercise, which is a critical distinction.
Key internal load indicators include:
- Heart rate (HR) and heart rate zones during exercise
- Session RPE (rating of perceived exertion), calculated by multiplying your effort rating by session duration
- Blood lactate concentration, measured through finger-prick samples
- Training impulse (TRIMP), which weights heart rate data by exercise duration
Session RPE is one of the most practical internal load tools available. An RPE score of 7 over a 90-minute session produces an sRPE of 630 units. That single number quantifies perceived effort in a way that is easy to track across weeks and months.
Heart rate is reliable for aerobic-dominant sports like distance running and cycling. For high-intensity team sports with repeated sprints, heart rate lags behind actual effort because of the cardiovascular system’s response delay. Blood lactate fills that gap but requires lab access or field testing equipment.
Pro Tip: Collect session RPE 20 to 30 minutes after training ends, not immediately after. Waiting lets acute fatigue settle so the rating reflects the full session more accurately.
4. What are athlete state metrics and how do they show readiness?
Athlete state metrics measure your body’s condition after exercise. They reflect recovery status and readiness for the next session. Confusing internal load with athlete state is one of the most common errors in performance monitoring, and it leads to poor training decisions.
Core athlete state indicators include:
- Heart rate variability (HRV), measured in the morning before activity
- Countermovement jump (CMJ) height, a fast and reliable neuromuscular readiness test
- Creatine kinase (CK) levels, a blood marker of muscle damage
- Muscle soreness questionnaires, which capture subjective recovery status
- Sleep quality and duration scores
The table below shows how these markers are used in practice:
| Athlete state metric | What it measures | When to collect |
|---|---|---|
| HRV | Autonomic nervous system recovery | Morning, before activity |
| CMJ height | Neuromuscular readiness | Pre-session, 2–4 times per week |
| Muscle soreness (scale 1–10) | Subjective recovery status | Morning or pre-session |
| CK levels | Muscle damage and inflammation | Post-match or heavy session |
A CMJ drop of more than 5% below baseline is a reliable signal to reduce training volume by 20–30% to lower injury risk. That threshold gives coaches a concrete, data-driven trigger rather than a gut feeling. Practitioners use weekly rolling averages of CMJ scores to filter out day-to-day noise and identify true changes in readiness.
Pro Tip: Never act on a single CMJ or HRV reading. Use a 5 to 7 day rolling average as your baseline. One low score is noise. Three consecutive low scores is a signal.
Nutrition plays a direct role in how quickly these markers recover. Pairing readiness monitoring with solid nutrition for athletic performance accelerates the recovery process and keeps athlete state metrics trending in the right direction.
5. How to integrate multiple performance metrics for better training
Combining external load, internal load, and athlete state data is the most effective approach to measuring athletic performance. Each category answers a different question. Together, they identify exactly where a training program is working and where it is not.
Sports performance testing replaces guesswork by pinpointing where athletes need improvement. Standard testing batteries include sprint speed, force and power output, change of direction, strength symmetry, and aerobic capacity. Running these tests every 4 to 8 weeks gives you enough data to detect real changes without over-testing.
Force-velocity profiling is one of the most useful integration tools available. Force-velocity slope deviations reveal whether an athlete has a force deficit or a velocity deficit. That distinction directly shapes whether a training block should prioritize heavy strength work or speed development. Without this profile, coaches often apply generic programs that miss the athlete’s actual limiting factor.
Individualized baselines matter more than population norms. A submaximal heart rate reliability of ICC 0.88 and a typical error of 1.6% confirms that heart rate is a trustworthy internal load tool when measured consistently. But what counts as “high” or “low” varies by athlete. Build individual baselines over 3 to 4 weeks before drawing conclusions.
The role of agility in sport performance connects directly to how external load and force-velocity data are interpreted. Agility metrics like change-of-direction speed and reactive agility scores add a sport-specific layer that raw distance or sprint data cannot capture alone.
6. Common mistakes in measuring and interpreting performance data
Most errors in sports performance monitoring come down to a few repeatable patterns. Recognizing them early saves months of wasted training.
- Conflating internal load with athlete state. Heart rate during a session is an internal load metric. HRV the next morning is an athlete state metric. Treating them as the same category produces flawed conclusions about fatigue and readiness.
- Relying on a single benchmark test. A single metric cannot assess all aspects of performance reliably under fatigue or pressure. One sprint test does not tell you about strength symmetry, aerobic capacity, or neuromuscular readiness.
- Ignoring biological noise. CMJ scores and HRV fluctuate daily due to sleep, hydration, and stress. Acting on a single data point without a rolling average leads to unnecessary training changes.
- Skipping individualized thresholds. Using population-level norms instead of individualized smallest practically important differences (SPID) causes coaches to miss meaningful changes or overreact to normal variation. Individualized confidence intervals improve detection of real performance shifts.
- Ignoring movement quality. Composite scores can mislead when movement quality and range of motion are not assessed alongside quantitative metrics. An athlete can post strong numbers while compensating for a movement dysfunction that increases injury risk.
“The goal of performance monitoring is not to collect data. It is to make better training decisions. Data without interpretation is just noise.”
Key takeaways
The most effective approach to measuring athletic performance combines external load, internal load, and athlete state metrics because each category captures a dimension the others cannot.
| Point | Details |
|---|---|
| Three-category framework | External load, internal load, and athlete state each answer a different question about training demand and recovery. |
| CMJ as a readiness trigger | A drop of more than 5% below baseline in CMJ signals a need to cut training volume by 20–30%. |
| Session RPE calculation | Multiply effort rating by session duration to get a single internal load number that is easy to track over time. |
| Test every 4–8 weeks | Benchmark testing on this schedule detects real performance changes without creating testing fatigue. |
| Individualized baselines win | Population norms miss athlete-specific variation; build personal baselines over 3–4 weeks before drawing conclusions. |
Why metrics alone will not make you a better athlete
I have worked with athletes who tracked everything and improved nothing. They had spreadsheets full of CMJ scores, HRV readings, and session RPE values. What they lacked was the discipline to act on the data consistently.
The athletes who benefit most from performance monitoring are not the ones with the most data. They are the ones who pick three to five metrics that match their sport, collect them consistently, and adjust training when the numbers signal a real change. A 1-unit drop in perceived fatigue correlates with roughly 400 meters more high-speed running the following day. That is a concrete, actionable relationship. Most athletes never learn it because they are too busy chasing the next metric.
The other mistake I see constantly is treating metrics as a substitute for coaching judgment. Heart rate is a valid internal load tool for aerobic sports. It is far less reliable for high-intensity team sports where effort spikes and recovers in seconds. Applying heart rate data from a distance runner to a basketball player produces misleading conclusions. Context is not optional.
Psychological factors matter too. An athlete’s athletic mindset shapes how they respond to fatigue, how honestly they report RPE, and how consistently they show up for testing. Metrics reflect the athlete in front of you. They do not replace the relationship between coach and athlete.
Start simple. Track training volume, session RPE, and one performance benchmark. Master those three before adding complexity. The data will tell you when you are ready to go deeper.
— Jason
Gear built for athletes who take performance seriously
Athletes who track their performance need gear that keeps up with their training demands. Teamjhall designs premium athletic apparel for competitors, coaches, and everyday athletes who chase results in every area of life.

The Teamjhall performance collection includes training tees, athletic tanks, and sports bras built for movement, breathability, and durability through hard sessions. The TJH Men’s Performance Tee and the UA Ladies Athletic Tee are built for athletes who train with intention and need gear that matches that standard. Teamjhall is more than apparel. It is a movement built on confidence, family, faith, loyalty, and consistency.
FAQ
What are the three main types of athletic performance metrics?
The three main categories are external load, internal load, and athlete state. External load measures physical work output, internal load captures physiological response during exercise, and athlete state reflects post-exercise recovery and readiness.
How often should athletes test their performance metrics?
Coaches recommend benchmarking performance every 4 to 8 weeks. CMJ and HRV should be collected multiple times per week to build reliable rolling averages for readiness monitoring.
What is session RPE and how is it calculated?
Session RPE is an internal load metric calculated by multiplying a perceived effort rating (on a 1 to 10 scale) by session duration in minutes. An RPE of 7 over 90 minutes equals an sRPE of 630 units.
What is the difference between internal load and athlete state?
Internal load metrics like heart rate and session RPE are collected during exercise and measure physiological stress. Athlete state metrics like HRV and CMJ are collected after exercise and measure recovery and readiness for the next session.
Can one metric accurately measure overall athletic performance?
No single metric captures all aspects of athletic performance reliably. Combining movement quality assessments, external load data, and recovery markers gives a far more accurate picture than any single test or score.