

Sport Performance Analytics: What It Means for Athletes
Sport performance analytics is the systematic practice of collecting, processing, and interpreting quantitative data and video to evaluate and improve athletic, technical, and tactical performance. In plain terms: it turns raw numbers and footage into decisions coaches and athletes can act on. The sport analytics definition covers everything from GPS sprint data to video breakdowns of a jump shot, all feeding one goal — better performance through evidence.
TL;DR
- Data collection: wearables, GPS, video, heart-rate monitors
- Processing: statistical modeling, tagging, machine learning
- Interpretation: identifying patterns, risks, and tactical edges
- Feedback: real-time or post-session delivery to coaches and athletes
- Primary purpose: decision support, not decision replacement
Pro Tip: When shopping for training apparel, look for fabrics that don’t interfere with wearable sensors. A snug, non-bunching fit keeps GPS and heart-rate monitors flush against the skin, which directly improves data accuracy.
Table of Contents
- What data does sport performance analytics actually measure?
- On-field vs. off-field analytics: what’s the difference?
- How analytics supports coaching decisions in practice
- Key metrics and what they actually tell you
- Who does this work and what skills do they need?
- Limitations and ethics you need to know
- How to get started: a practical checklist with timelines and costs
- Key Takeaways
- Why analytics-informed training shapes what we build at Teamjhall
- Useful sources for further reading
- What the data really means for how you train and gear up
What data does sport performance analytics actually measure?
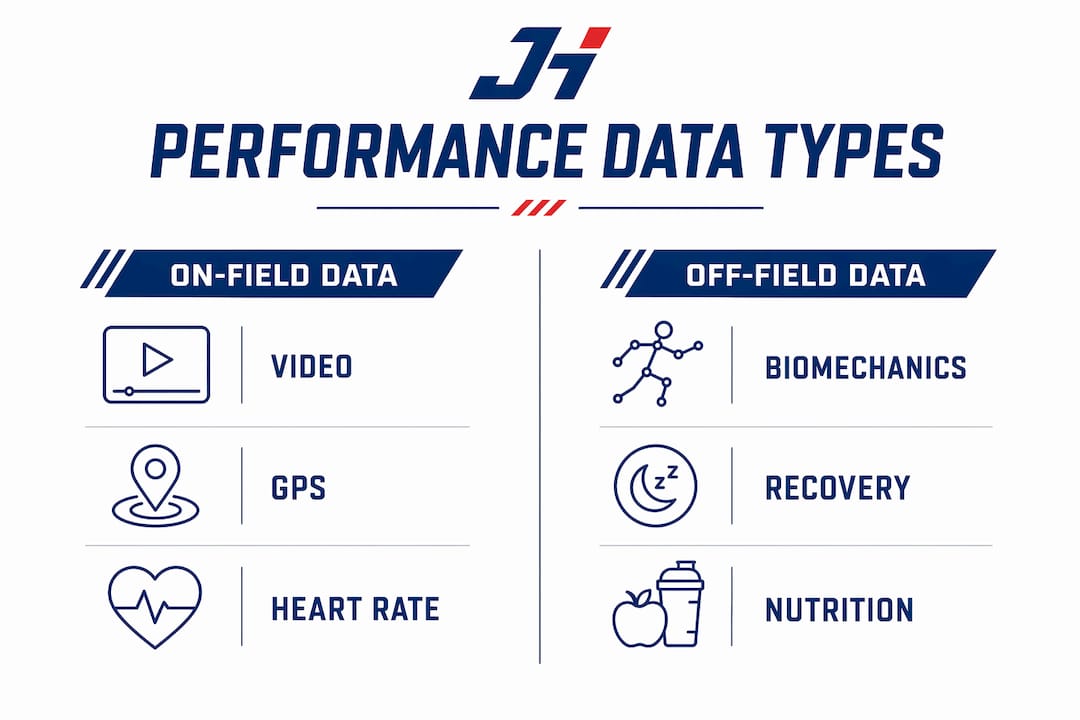
Performance analytics draws from several distinct data streams, each answering a different question about an athlete’s body and behavior.
| Data type | Typical metrics | How a coach uses it |
|---|---|---|
| Video / notational | Technical errors, tactical patterns, shot selection | Frame-by-frame review of a pitcher’s release point |
| GPS / positional | Total distance, sprint count, field coverage | Measuring a midfielder’s high-intensity running load per half |
| Wearable IMU | Acceleration, deceleration, jump height | Flagging asymmetric landing forces in a basketball player |
| Heart rate / HRV | Resting HR, heart-rate variability, recovery score | Deciding whether to reduce training intensity on a given day |
| Sleep / recovery | Sleep duration, sleep quality score | Adjusting next-day session volume after poor sleep |
| Session RPE | Perceived exertion rating (1–unknown scale) | Cross-checking subjective load against GPS output |
| Contextual / event tags | Score state, opponent, weather, surface | Comparing sprint output in winning vs. losing game states |
Common tools include video-notational software, GPS and inertial wearables, heart-rate monitors, and athlete-management platforms that centralize all streams. Analysts often layer internal club data with external event providers to fill gaps no single sensor covers.
Pro Tip: You don’t need every data type at once. Pick one stream that matches your biggest training question — sprint load for team sports, HRV for endurance athletes — and master it before adding more sensors.
On-field vs. off-field analytics: what’s the difference?
Sports analytics splits cleanly into two categories with very different audiences and goals.
| Dimension | On-field analytics | Off-field analytics |
|---|---|---|
| Goal | Improve athletic performance and tactics | Increase revenue, fan engagement, operations |
| Primary users | Coaches, sport scientists, athletes | Marketing, ticketing, front-office staff |
| Typical data | GPS, video, biometrics, session loads | Ticket sales, merchandise trends, social media |
| Example decision | Reduce a player’s sprint volume before playoffs | Adjust jersey pricing based on demand patterns |
On-field analytics is what most athletes and coaches mean when they say “performance analysis in sports.” Off-field analytics is the business engine. The practical distinction matters because the tools, skills, and ethical obligations differ sharply between the two.
For a performance-minded shopper, on-field data is the relevant side. Sprint load data, for example, tells a coach when an athlete needs compression recovery gear versus breathable high-output fabrics — a direct line from numbers to apparel choices.
How analytics supports coaching decisions in practice
The primary purpose of performance analysis in sports is feed-forward coaching: using data to prepare and rehearse for what comes next, not just to review what went wrong. Analytics reduces subjective speculation and gives coaches evidence-based interventions they can defend and repeat.
The workflow follows a four-step cycle:
- Capture — record video, sensor streams, and event tags during training or competition.
- Code — tag key events (turnovers, sprint efforts, technical errors) using notation software.
- Analyse — run statistical summaries and identify patterns across sessions or opponents.
- Feedback — deliver targeted clips and data reports to coaches and athletes, live or post-session.
Concrete use cases include training periodization (adjusting weekly volume based on accumulated load), injury prevention through workload monitoring, opponent scouting via tactical video breakdowns, and talent identification using objective output benchmarks. Coaches who integrate sports training programs with this cycle see faster, more consistent athlete development.
Pro Tip: Pick one metric from your last session — total sprint distance or session RPE — and compare it to the same session from three weeks ago. That single comparison is your first analytics feedback loop.
Key metrics and what they actually tell you
Understanding athletic performance metrics means knowing not just what a number is, but what it signals.
| Metric | Unit | What it indicates | Apparel implication |
|---|---|---|---|
| Speed / top velocity | mph or m/s | Neuromuscular power output | Lightweight, low-drag fabrics |
| Total distance | miles or km | Overall session volume | Durable, moisture-wicking construction |
| High-intensity efforts | count per session | Anaerobic demand | Compression shorts for muscle support |
| Acute:chronic workload ratio | ratio (target range) | Injury risk window | Recovery tights after high-ratio sessions |
| Heart rate (HR) | bpm | Cardiovascular intensity | Breathable panels in chest and back |
| Heart rate variability (HRV) | ms | Readiness and recovery status | Soft, non-restrictive sleepwear for overnight recovery |
| Sleep duration / quality | hours / score | Systemic recovery | Comfortable, temperature-regulating fabrics |
| Session RPE | unknown scale | Perceived internal load | Flexible waistbands for comfort during high-effort sets |
A few interpretation notes worth knowing: a rising acute:chronic workload ratio suggests pulling back volume before injury risk spikes. Low HRV on consecutive mornings usually signals the body needs a lighter day, not a harder one. And RPE that consistently runs higher than GPS load suggests the athlete may be under-recovered or under-fueled — a cue to revisit nutrition and sleep alongside training volume.
Common pitfalls include over-reacting to a single data point, ignoring sensor drift (wearables lose accuracy when worn loosely or in extreme heat), and stripping context from numbers entirely.
Who does this work and what skills do they need?
Sport performance analytics is a team effort. Roles typically include:
- Performance analyst — codes video, builds reports, delivers feedback to coaches
- Sport scientist — designs load-monitoring protocols and interprets physiological data
- Strength and conditioning coach — translates data into training program adjustments
- Data engineer — manages pipelines, integrates data sources, maintains data quality
- Video analyst — specializes in tactical and technical breakdown using footage
- Medical and performance staff — uses injury and recovery data to guide return-to-play decisions
Core skills across all roles: statistical literacy, video notation, domain sport knowledge, communication (translating models into plain coaching language), data cleaning, and privacy awareness. The University of Delaware’s sports performance analytics program frames it as a blend of data science and sport science — neither alone is sufficient.
Individual athletes and small teams don’t need all these roles in-house. A single sport scientist with video software and a wearable tracker covers most of the cycle. Outsourcing video coding or using automated athlete-management platforms fills the gaps affordably.
Limitations and ethics you need to know
Analytics is only as good as the data feeding it. Poor-quality sensors, inconsistent tagging, and small sample sizes produce misleading outputs. Confirmation bias is a real risk: analysts who already believe a player is fatigued tend to find data that confirms it.
The most important governance rule in sport analytics: data should inform the coach’s decision, not replace it. Coaches and athletes recall only about 30% of on-field events without data support — analytics fills that gap, but human judgment still sets the context and the intervention.
In the U.S., biometric data from athletes carries significant privacy obligations. Athletes should provide informed consent before any biometric collection begins. Data should be stored securely, access should be role-limited, and ownership of an athlete’s personal performance data should be clearly defined in writing before a season starts.
Pro Tip: Even a small team should have a one-page data policy: what you collect, who can see it, how long you keep it, and how an athlete can request deletion. It takes 30 minutes to write and prevents serious disputes later.
How to get started: a practical checklist with timelines and costs
Getting into performance analytics doesn’t require a full analytics department. Here’s a realistic starting path:
- Define your goal — pick one performance question (e.g., “Are my athletes accumulating too much load before competition?”).
- Choose 1–2 metrics — match the metric to the question (workload ratio for load management, HRV for recovery monitoring).
- Trial a tool — most wearable and video platforms offer free trials; start with what your sport already uses.
- Build a weekly reporting habit — a simple spreadsheet updated after each session beats a sophisticated platform nobody checks.
- Review and adjust — after four weeks, compare your data to your original question and make one training change.
| Setup level | Tools | Estimated monthly cost | Timeline to first insight |
|---|---|---|---|
| Individual athlete | Consumer wearable + free app | — | 1–2 weeks |
| Small team (basic) | Team wearable pack + spreadsheet | — | 2–4 weeks |
| Semi-pro team | Athlete-management platform + video software | — | 4 weeks |
Apparel matters here too. Sensors worn over bunching fabric or loose waistbands produce noisy data. When choosing training gear, prioritize a close, consistent fit — performance-focused shorts and compression layers keep sensors stable through agility drills and high-intensity intervals alike.
Pro Tip: Data visualization tools help enormously once you have more than a few weeks of data. Visual dashboards for practice and match data make patterns visible that raw spreadsheets hide.
Key Takeaways
Sport performance analytics turns raw data and video into feed-forward coaching decisions that improve training, reduce injury risk, and sharpen tactical preparation.
| Point | Details |
|---|---|
| Core definition | Analytics collects, processes, and interprets data and video to improve athletic performance. |
| Primary purpose | Feed-forward decision support — it augments coach judgment, never replaces it. |
| Top metrics to track | HRV, acute:chronic workload ratio, session RPE, and speed are the highest-value starting points. |
| Startup path | Define one goal, pick two metrics, trial a wearable, and build a weekly review habit. |
| Apparel connection | Close-fitting, non-bunching fabrics improve sensor accuracy and support recovery between sessions. |
Why analytics-informed training shapes what we build at Teamjhall
At Teamjhall, we pay attention to how athletes actually train. When coaches use load data to prescribe recovery days, athletes need gear that works as hard in a cool-down walk as it does in a sprint session. When HRV data drives early-morning readiness checks, the clothes worn overnight and into warm-up matter for comfort and temperature regulation.
Our fabrics and cuts are designed with those patterns in mind: moisture-wicking construction for high-output sessions, flexible fits that don’t restrict movement during agility work, and durable materials built for athletes who train consistently, not occasionally. The Teamjhall store carries performance apparel built for competitors who take their training seriously — whether or not they have a sport scientist on staff.

Useful sources for further reading
- Analytics, Technology and High Performance Sport — A detailed academic chapter on how technology shifted sport analytics from paper-and-pencil to statistical modeling; conceptual and definition-focused.
- Sports Performance Analytics — University of Delaware — Practitioner-facing overview of the skills, roles, and career paths in the field.
- Sports Analytics — Encyclopedia MDPI — Accessible definition covering on-field and off-field distinctions; good starting point for newcomers.
- Performance Analysis — Sport NI — Practitioner guide explaining how video and data feedback work in real coaching environments.
- What Is Performance Analysis in Sport? — Practitioner-facing explainer of the Capture–Code–Analyse–Feedback cycle with real examples.
- How AI Identifies Improvement Opportunities — Practitioner example of automated pattern detection from practice data; useful for understanding AI-assisted analytics in action.
What the data really means for how you train and gear up
Most athletes hear “analytics” and picture an NBA front office with a wall of screens. The reality is more accessible. A $25 heart-rate monitor and a free app give any serious athlete a meaningful data loop inside two weeks.
The part most guides skip: analytics only works when the physical inputs are clean. Loose gear, poor sensor placement, and inconsistent wearing habits corrupt the data before it ever reaches a spreadsheet. That’s not a technology problem. It’s a fit problem. Choosing apparel that stays put through sprints, cuts, and heavy lifts isn’t a style preference — it’s a data-quality decision.
The other thing worth saying plainly: numbers don’t make coaches obsolete. Elite sport performance analysis covers technical, tactical, physical, and psychological pillars precisely because no single metric captures the full picture. A coach who understands the data and the athlete will always outperform one who trusts only the dashboard.
Start small. Track one metric. Wear gear that doesn’t get in the way. Build from there.